

The figures, from Public Health England, show the neighbourhoods that recorded the most cases between November 9-16 and are available to view on an interactive map.
Please note the images used are for illustrative purposes only and not linked to any data.
In these confusing and worrying times, local journalism is more vital than ever. Thanks to everyone who helps us ask the questions that matter by taking out a subscription or buying a paper. We stand together. Nancy Fielder, editor.
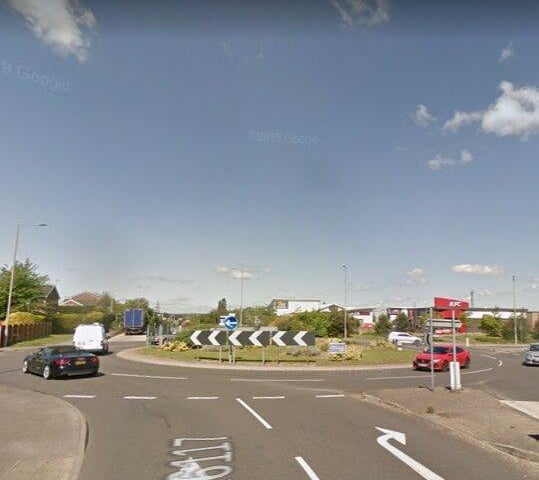
5. FOREST TOWN AND NEWLANDS- 44 NEW CASES
Between November 9-16, 44 new cases were recorded here. The data is showing cases are increasing in this area- they were up by eight cases from the previous week, a 22.2 per cent increase. Photo: Google Maps
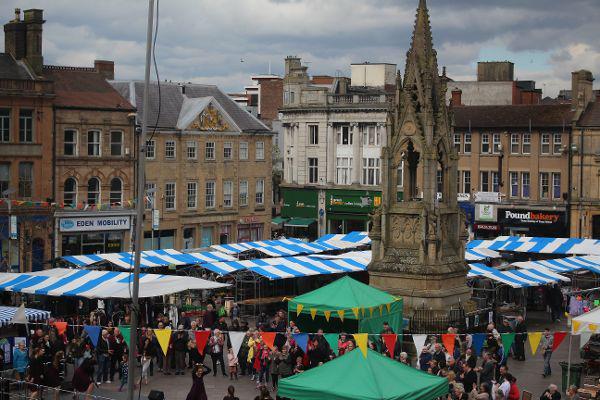
6. MANSFIELD TOWN CENTRE- 37 NEW CASES
A total of 37 new cases were recorded here between November 9-16. The data shows a decrease in cases in this area- the number was down by six cases from the previous week, or a 14% drop. Photo: Google Maps
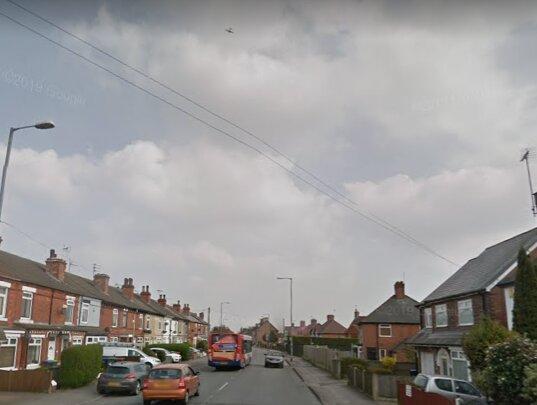
7. SUTTON ST MARY'S AND ASHFIELDS- 37 NEW CASES
A total of 37 new cases were recorded here between November 9-16. The data shows cases are falling in this area- they were down by 10 from the previous week, a 21.3% decrease. Photo: Google Maps
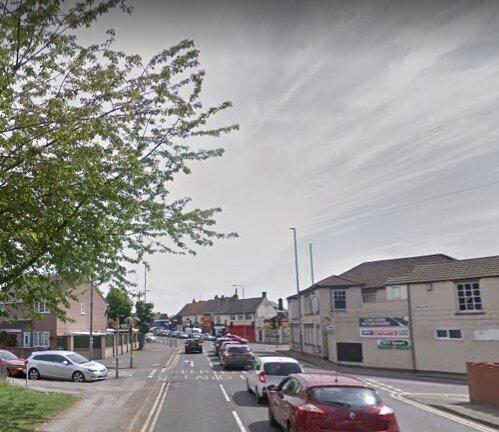
8. SUTTON FOREST SIDE AND NEW CROSS- 36 NEW CASES
A total of 36 new cases were recorded here between November 9-16. The data shows the case rate in this area is static. Photo: Google Maps