


The figures, from Public Health England, are available to view in an interactive map and show which neighbourhoods saw a decrease in cases between November 7-14.
Meanwhile, the UK government has said it is still too soon to judge whether the England-wide lockdown imposed on 5 November has had any impact on Covid-19 infection rates across the country.
While restrictions will remain in place until 2 December, the latest figures suggest rates are still continuing to increase in most local authorities in England.
Overall, 24 of the 40 local authority areas in the East Midlands are currently seeing a rise in rates.
Please note that the images used for illustrative purposes only and not linked to the data.
In these confusing and worrying times, local journalism is more vital than ever. Thanks to everyone who helps us ask the questions that matter by taking out a subscription or buying a paper. We stand together. Nancy Fielder, editor.
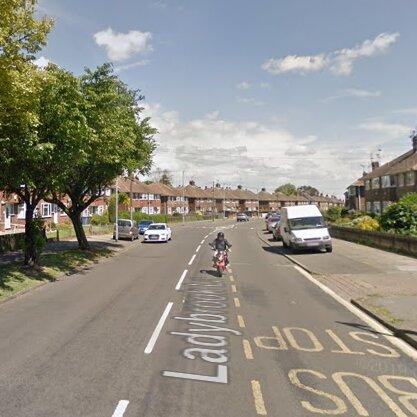
5. GRANGE FARM AND LADYBROOK- 35.9% DROP IN CASES
A total of 25 cases were recorded here during the week leading up to November 14. This was down by 14 cases from the previous week, equating to a 35.9 per cent drop in cases. Photo: Google Maps
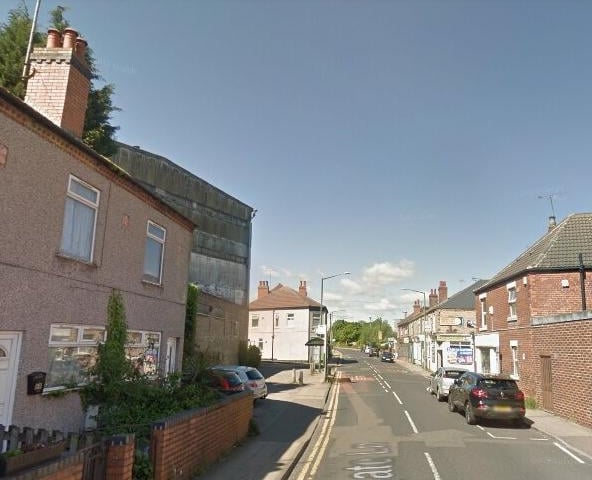
6. NEWGATE AND CARR BANK- 34.3% DROP IN CASES
A total of 23 cases were recorded here during the week leading up to November 14, down by 12 cases from the previous week and equating to a 34.3 per cent drop in cases. Photo: Google Maps
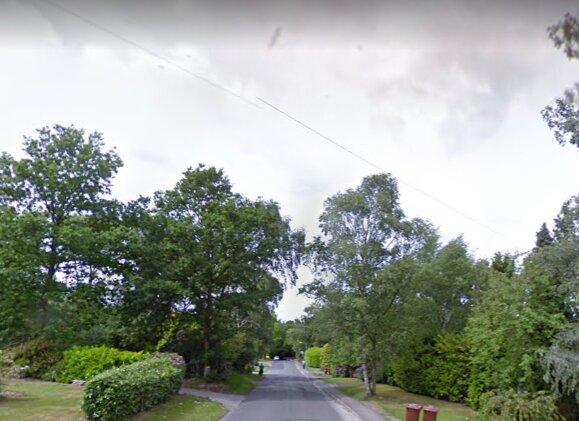
7. RAVENSHEAD AND NEWSTEAD- 23.1% DROP IN CASES
A total of 20 cases were recorded here during the week leading up to November 14, down by 6 from the previous week and showing a 23.1 per cent decrease. Photo: Google Maps
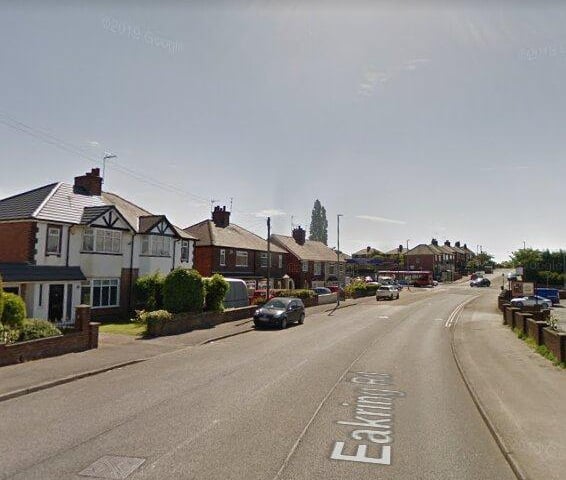
8. EAKRING AND LING FOREST- 21.7% DROP IN CASES
A total of 18 cases were recorded here during the week leading up to November 14, down by five cases from the previous week and showing a percentage decrease of 21.7. Photo: Google Maps