Across the UK there were 521,602 positive test results in the week to December 16, up 51 per cent from the week before.
Lambeth, London, recorded the UK’s highest case rate, with 2477.2 cases per 100,000 people, while Scarborough, North Yorkshire. recorded the lowest case rate, with 258.4 cases per 100,000 people recorded.
At a regional level, London has the highest infection rates in the UK, with 1455.8 cases per 100,000 people, followed by the East of England, with 893.5 cases per 100,000. The North East has the lowest rate, with 435.3 cases per 100,000.
At neighbourhood level, Covid-19 case rates have been published for the week ending December 16.
In Mansfield, the rate of new cases per 100,000 population, was 646.5.
Mansfield is now ranked 196th in the country.
Here are the neighbourhoods in Mansfield area with the highest case rates in the past week.
.

1. b25lY21zOjU1YTAxYjM0LWMxZGUtNDFkNS1iM2RlLTE5MGM1OTAxNzQwMDo2YzBlMDcxOC0xN2MxLTRkYzEtODg2Mi1hMTA4N2I0ZWY0NjI= (1).jpg
See which ward areas around Mansfield have the highest and lowest rates of Covid infection. Photo: Pixabay

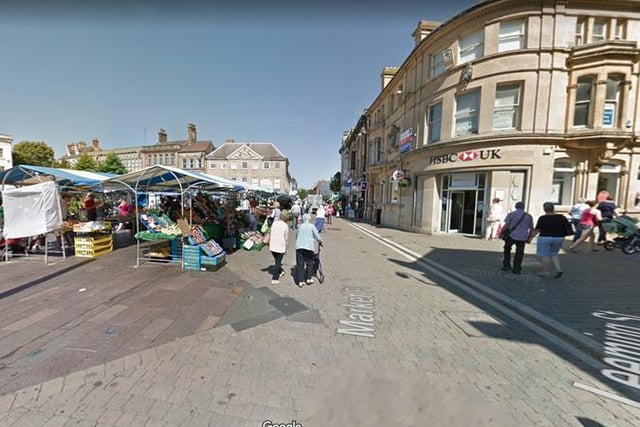
2. Mansfield Town Centre and Broomhil
Mansfield Town Centre and Broomhill: Rate of cases per 100,000, week to December 9 are at 301.7. Rate of cases per 100,000, week to December 16 are now at 754.4 a 150 per cent change. The local authority rank by change in case rate (1= neighbourhood with fastest rising case rate in local authority) is 5. Local authority rank by highest case rates (1= highest case rates in local authority) is 44. Photo: Google

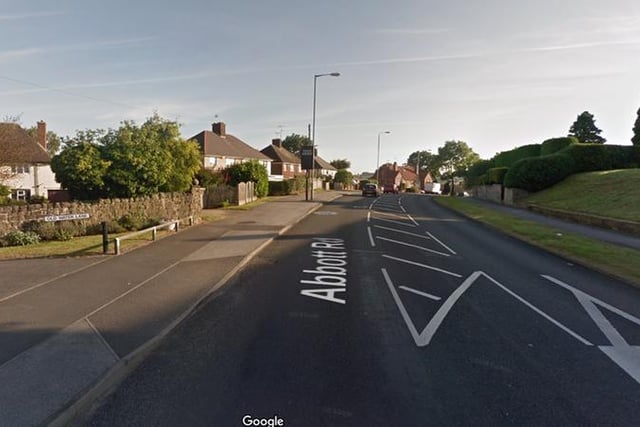
3. Abbott Road and Pleasley Hill
Abbott Road and Pleasley Hill: Rate of cases per 100,000, week to December 9 are at 565.9 Rate of cases per 100,000, week to December 16 are now at 601.3 a 6.3% per cent change. The local authority rank by change in case rate (1= neighbourhood with fastest rising case rate in local authority) is 76 Local authority rank by highest case rates (1= highest case rates in local authority) is 69 Photo: Google

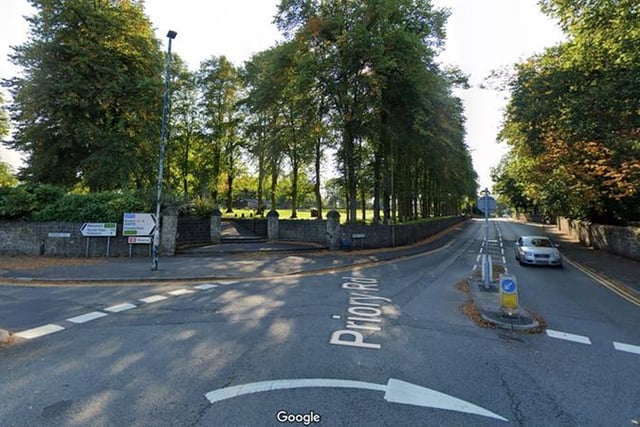
4. Yeoman Hill and Maun Valley
Yeoman Hill and Maun Valley Rate of cases per 100,000, week to December 9 are at 469 Rate of cases per 100,000, week to December 16 are now at 637.4 a 35.7 per cent change. The local authority rank by change in case rate (1= neighbourhood with fastest rising case rate in local authority) is 52 Local authority rank by highest case rates (1= highest case rates in local authority) is 64 Photo: Google
