


The latest figures from Public Health England shows the number of new covid-19 cases between August 30 and September 5 in an interactive map.
The map splits the country up by Middle Super Output Area, which are areas with an average population of 7,200 people.
The data is updated every weekday, and the map shows the latest seven days for which complete data is available.
It shows eight Mansfield areas have seen a higher than average rise in cases of the virus.
Areas where there are two or less cases are not flagged up as potential 'coronavirus hotspots' and are therefore not reflected on the map.
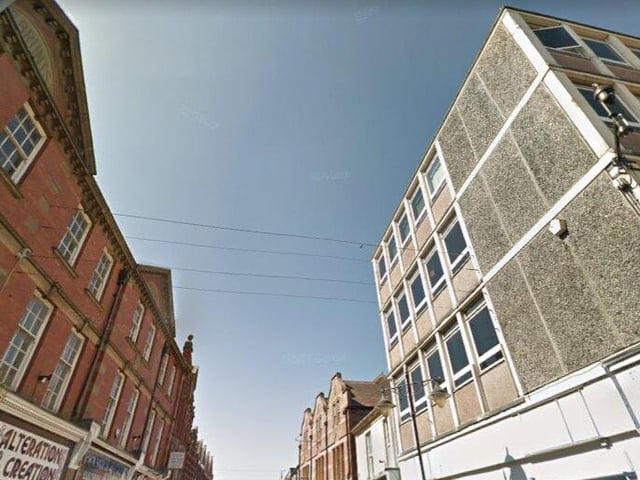
1. MANSFIELD TOWN CENTRE AND BROOMHILL
This area has reported the highest number of new cases- seven from August 30 to September 5. Photo: Google Maps
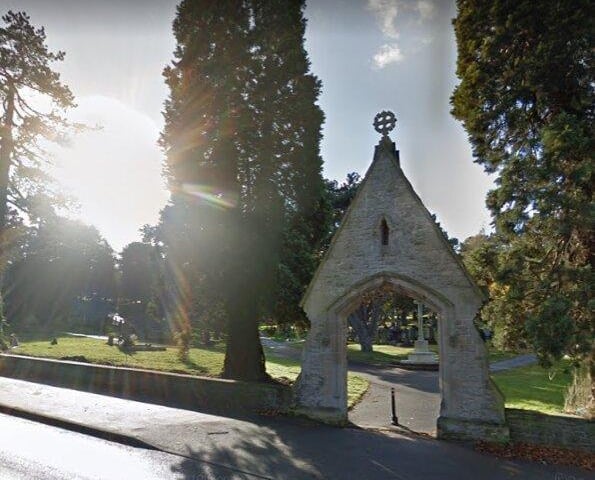
2. KING'S WALK, BERRY HILL AND OAKHAM
Six cases of the virus were reported in this area from August 30 to September 5. Photo: Google Maps
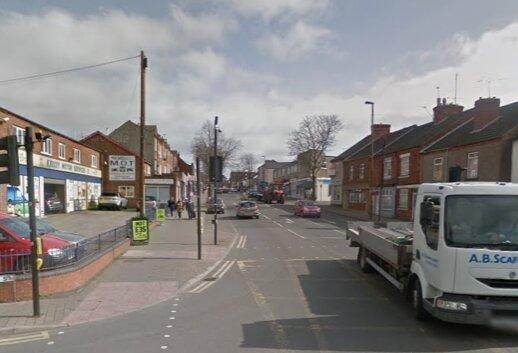
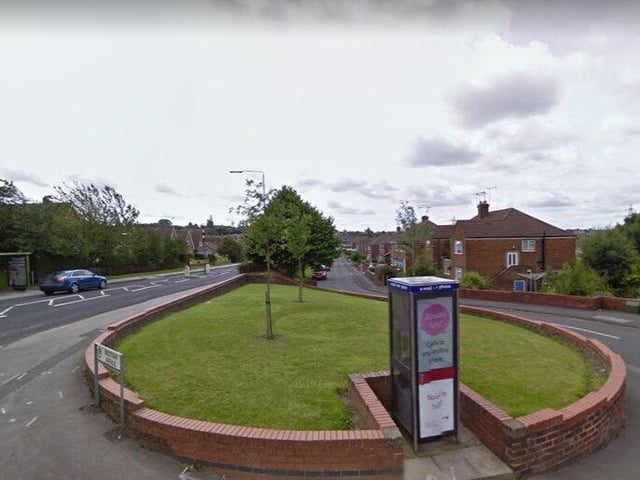
4. KIRKBY LARWOOD AND KINGSWAY
Four new cases of Covid-19 in this area. Photo: Google Maps