


Take a look at the coronavirus stats area by area, for the Mansfield area. The figures are according to the latest numbers on the Government’s interactive case rate map.
The stats reveal mainly rising figures for many of the Mansfield District Council wards and are shown per 100,000 people over a seven-day period up, to November 16, 2021.
To see the government's interactive map, and latest national Covid 19 figures, see: https://coronavirus.data.gov.uk/
To see the government's interactive map, and latest national Covid 19 figures, see: https://coronavirus.data.gov.uk/
9. Coronavirus cases fell in Woodhouse according to the latest stats
DOWN : Woodhouse, in the seven days to November 16, 2021. The total cases are now 22. The rate has decreased relative to the previous week.-9 (-29.0%) The case rate per 100,000 people was 258.8. Photo: Google Map
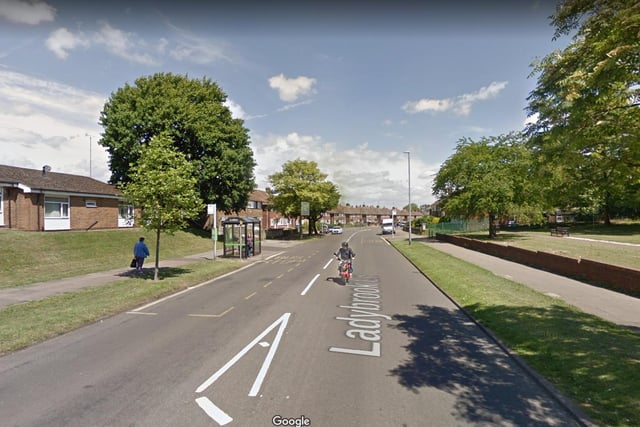
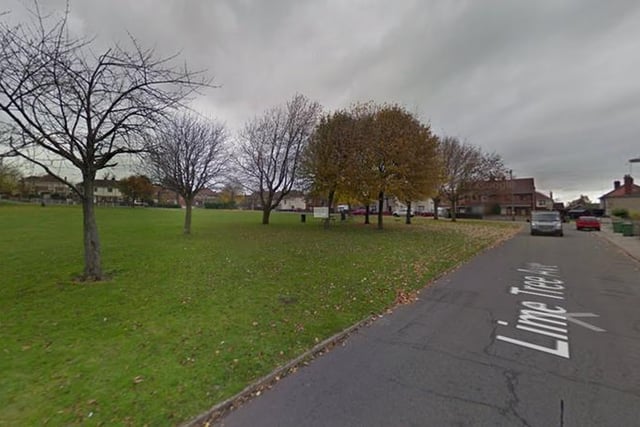
10. Grange Farm and Ladybroook saw a rise according to the latest coronavirus figures
UP: Grange Farm and Ladybrook. In the seven days to November 16, 2021, total cases were 37, the rate has increased relative to the previous week.7 (23.3%) with case rates per 100,000 people now at 351.3. Photo: Google Map
11. The numbers have gone up at Newgate and Carr Bank
UP: Newgate and Carr Bank. In the seven days to November 16, 2021 the total cases were 34. The rate has increased relative to the previous week.12 (54.5%) with the case rate per 100,000 people at 407.2. Photo: Google Map
12. More cases reported at Manor Hornby and Peafields
UP: Manor, Hornby & Peafields, in the seven days to November 16, 2021, saw the total cases recorded as 29. The rate has increased relative to the previous week.7 (31.8%) with case rates per 100,000 people at 380.6 Photo: Google Map