Here are the latest Covid-19 infection rates for Mansfield and Ashfield

Mansfield and Ashfield continue to have relatively low rates of Covid-19 infection compared to other parts of the country, according to the latest Government figures.
Watch more of our videos on Shots! 
and live on Freeview channel 276
Visit Shots! now

The figures, for the seven days to July 30, are based on tests carried out in laboratories (pillar one of the Government's testing programme) and in the wider community (pillar two).

With two new pillar one cases and nine pillar 2 cases Mansfield has a rate of 1.8 and 8.3 per 100,000 respectively.

Hide Ad
Hide Ad

Ashfield had three new pillar one infections and three pillar two, a rate of 2,4 and 2.4 cases per 100,000 respectively.

A woman wearing PPE (personal protective equipment) (Photo by Oli SCARFF / AFP) (Photo by OLI SCARFF/AFP via Getty Images)A woman wearing PPE (personal protective equipment) (Photo by Oli SCARFF / AFP) (Photo by OLI SCARFF/AFP via Getty Images)
A woman wearing PPE (personal protective equipment) (Photo by Oli SCARFF / AFP) (Photo by OLI SCARFF/AFP via Getty Images)

Data for the most recent three days (July 31-August 2) has been excluded as it is incomplete and likely to be revised.

Nottinghamshire County and Nottingham City councils publish Covid-19 Surveillance Reports to help regions respond to outbreaks and to suppress the spread of infection.

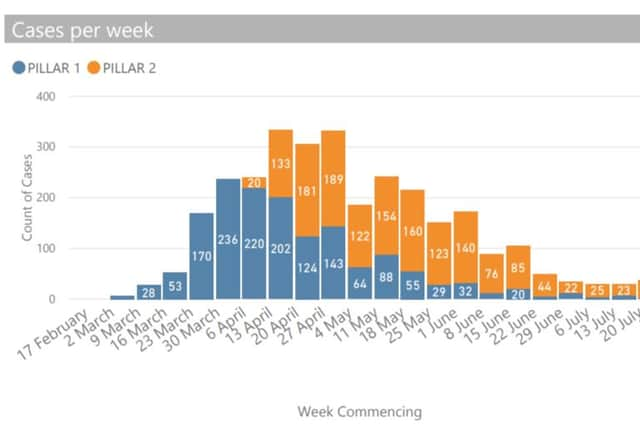
The figures from February 21 to July 26 show Ashfield has had a cumulative infection rate close to the national average, Mansfield was below the national average and the Bassetlaw area was above the national rates per 100,000 population. The peak of the pandemic was April 27.

Hide Ad
Hide Ad
Notts weekly covid report to July 26.Notts weekly covid report to July 26.
Notts weekly covid report to July 26.

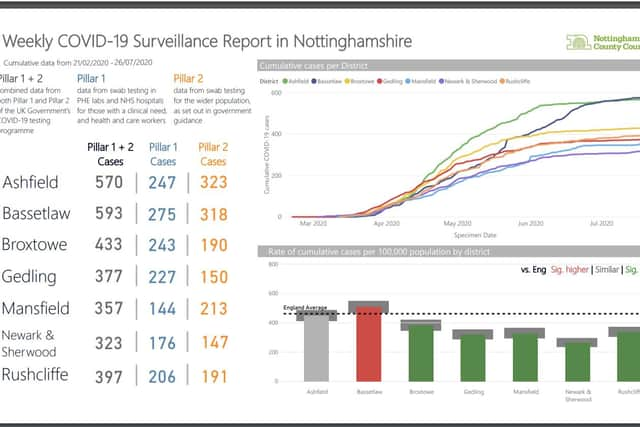
Millions of people in parts of northern England are now facing new restrictions, banning separate households from meeting each other at home after a spike in Covid-19 cases.

The rules impact people in Greater Manchester, east Lancashire and parts of West Yorkshire.

According to the figures hotspots around the UK are

Blackburn with Darwen 79.9 (119), 77.2 (115)

Figures show when covid-19 infections peaked earlier this year.Figures show when covid-19 infections peaked earlier this year.
Figures show when covid-19 infections peaked earlier this year.

Oldham 62.8 (148), 41.6 (98)

Bradford 53.4 (287), 46.9 (252)

A message from the Editor:

Thank you for reading this story on our website. While I have your attention, I also have an important request to make of you.

In order for us to continue to provide high quality and trusted local news on this free-to-read site, I am asking you to also please purchase a copy of our newspaper.

Our journalists are highly trained and our content is independently regulated by IPSO to some of the most rigorous standards in the world. But being your eyes and ears comes at a price. So we need your support more than ever to buy our newspapers during this crisis.

With the coronavirus lockdown having a major impact on many of our local valued advertisers - and consequently the advertising that we receive - we are more reliant than ever on you helping us to provide you with news and information by buying a copy of our newspaper.

Thank you

Nancy Fielder, editor